Assignment 9: Many processes make light work
Due in two parts — Friday, April 8 and Friday April 15 — before midnight
The goals for this assignment are:
-
Implement an algorithm using multiple processes with fork()
-
Compare single- and multi-process implementation performance
-
Work with fork(), wait(), process ids, and shared memory
Mandelbrot Set
The mandelbrot set is fractal popularized by Benoit Mandelbrot in 1980.
The mandelbrot set consists of the set of complex numbers z for which \(z^2 + c\) does not diverge to infinity when z starts at 0. To visualize this set, recall that a complex number, \(z = x + yi\), can be visualized as a 2D point \((x,y)\). Although the set derives from complex numbers, we can compute the set by thinking about 2D coordinates, \((x,y)\).
To see whether the complex number \((x,y)\) diverges, we simply need a loop that repeatedly computes \(z^2 + c\). If we expand the complex number multiplication of \(z = x + y*i\), z will change each iteration based on the following algorith. To test for divergence, we check whether z goes out of the bounds of 4*4. If z does go out of bounds, we assign it a color based on how quickly it "escaped" the distance 4*4. If after MAX iterations, z is still smaller than 4*4, it belongs to the set and we color it black.
The last thing we need to draw the set is the region of values for x and y that bound the set. X should vary from -2.0 to 0.47. Y should vary from -1.12 to 1.12. Here is the full algorithm. Assume that the image width and height are the same, e.g. square images.
for each row in the image
   for each col in the image
      xfrac = row / image_size
      yfrac = col / image_size
      x0 = xmin + xfrac * (xmax - xmin)
      y0 = ymin + yfrac * (ymax - ymin)

      x = 0
      y = 0
      iter = 0
      while (iter < MAX && x*x + y*y < 2*2)
        xtmp = x*x - y*y + x0
        y = 2*x*y + y0
        x = xtmp
        iter++

      if (iter < MAX) // escaped
        color = palette[iter]
      else
        color = black

      write color to image at location (row,col)
Palette
The palette should contain the same number of colors as MAX iterations.
Use ppm_pixel to represent colors in the pallet. You can either generate
random colors or compute a base color and jitter it e.g.

|
|

|
|
1. Single
This is due Friday April 8, before midnight
In the file, single_mandelbrot, compute a program that outputs a PPM image of the mandelbrot
set. You have been given basecode that initializes the following values from command line arguments. This code uses the getopt function.
Arguments:
-
-s <size>the image width and height -
-l <xmin>the leftmost coordinate, e.g. minimum x value -
-r <xmax>the rightmost coordinate, e.g. maximum x value -
-t <ymin>the topmost coordinate, e.g. minimum y value -
-b <ymax>the bottommost coordinate, e.g. maximum y value

When you run your program, you should get the output such as the following
$ make single_mandelbrot
$ ./single_mandelbrot
Generating mandelbrot with size 480x480
  X range = [-2.0000,0.4700]
  Y range = [-1.1200,1.1200]
Computed mandelbrot set (480x480) in 0.323261 seconds
Writing file: mandelbrot-480-1649001071.ppm
Requirements and hints:
-
You should re-use your PPM functions from A06. If you use a 2D array of arrays, be sure to modify and commit
read_ppm.h! -
Allocate an array of pixels using malloc and then save the final image using
write_ppm. -
You should output the number of seconds needed to compute the image. Use this class example, matrix.c for an example.
-
Your output filename should have the format
mandelbrot-<size>-<timestamp>.ppm. The timestamp can be obtained by callingtime(0). -
Set a random seed to ensure that the color palette is different each time, e.g.
srand(time(0)) -
In your
README.adoc, callsingle_mandelbrotwith sizes of 100, 400, 800, 1000, and 2000. Record the number of seconds it takes to compute each image. -
(Optional) Experiment with visualizing other regions of the mandelbrot set. For example, if you run with
./single_mandelbrot -s 480 -l -0.02524993 -r 0.00975 -b -0.8172 -t -0.79725, you get the following image

2. Multiple
This is due Friday April 15, before midnight
In the file, multi_mandelbrot, compute a program that outputs a PPM image of
the mandelbrot set using multiple processes spawned with fork(). Your
basecode implements the same command line arguments in with single_mandelbrot.
Your program should use shared memory to split the computation of the image across
4 child processes. After each child completes, the parent process should save the
result to a file using write_ppm.
$ ./multi_mandelbrot
Generating mandelbrot with size 480x480
  Num processes = 4
  X range = [-2.0000,0.4700]
  Y range = [-1.1200,1.1200]
Launched child process: 9150
Launched child process: 9151
9150) Sub-image block: cols (0, 240) to rows (0,240)
9151) Sub-image block: cols (240, 480) to rows (0,240)
Launched child process: 9152
9152) Sub-image block: cols (0, 240) to rows (240,480)
Launched child process: 9153
9153) Sub-image block: cols (240, 480) to rows (240,480)
Child process complete: 9150
Child process complete: 9152
Child process complete: 9151
Child process complete: 9153
Computed mandelbrot set (480x480) in 0.152178 seconds
Writing file: multi-mandelbrot-480-1649001405.ppm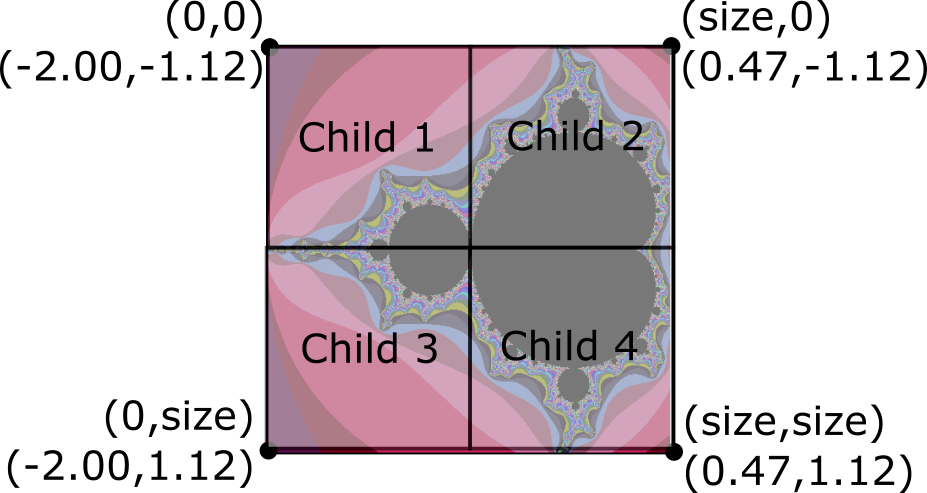
Requirements and hints:
-
You should re-use your PPM functions from A06. If you use a 2D array of arrays, be sure to modify and commit
read_ppm.h! -
Allocate an array of pixels using
shared memoryand then save the final image usingwrite_ppm. Use the example from class as a reference. -
Print the pids and work tasks for each child.
-
Refactor the code from
single_mandelbrotto compute the mandelbrot set using a function. Then re-use the same function in bothsingle_mandelbrot.candmulti_mandelbrot.c -
Use
fork()to create 4 child processes andwait()to wait for each to complete. -
You should output the number of seconds needed to compute the image. Use this class example, matrix.c for an example.
-
Your output filename should have the format
multi-mandelbrot-<size>-<timestamp>.ppm. The timestamp can be obtained by callingtime(0). -
Set a random seed to ensure that the color palette is different each time, e.g.
srand(time(0)) -
In your
README.adoc, callsingle_mandelbrotwith sizes of 100, 400, 800, 1000, and 2000. Record the number of seconds it takes to compute each image.
3. Submit your work
Submit both your code, images, and a brief report containing your results in your README.
1) Push your code work to github
$ git status
$ git add .
$ git status
$ git commit -m "assignment complete"
$ git status
$ git push
$ git status